
Abstract
Success and failure outcomes in three achievement-oriented common-life situations were simulated in the Trent Attribution Profile (TAP) with both self and others-orientations. The TAP provides measures of locus of control and stability dimensions which can be further partitioned into individual attribution elements (i.e., ability, effort, task difficulty, and luck) under four different conditions (self- success, other-success, self-failure, other-failure). The Internality dimension of the TAP was correlated significantly with Rotter’s I-E Scale. The test-retest reliability coefficient was significant. Traditional success-failure and self-other biases were also obtained.
Rotter’s (1968) Internal-External Locus of Control (I-E) Scale measures individual differences in generalized beliefs regarding behavior-outcome relationships (i.e., attribution schema1). The I-E Scale consists of forced-choice items, each of which offers an internal and an external alternative. This scale thus yields only one global score of Internality.
According to Weiner (e.g., Weiner et al., 1971), causal attributions, at least in achievement-oriented contexts, involve both the locus of control (internal versus external) and the stability (stable versus unstable) dimensions. The internal source of attribution consists of ability and effort; the external source, task difficulty and luck. Ability and effort constitute stable attribution elements, whereas effort and luck constitute unstable elements. Weiner’s model, which has been supported by a number of studies, has proven to be very useful in unravelling causal attribution processes (e.g., Frieze, 1973). However, Rotter’s I-E Scale does not allow the partitioning of attribution schema into the locus of control and stability dimensions; nor does it permit the assessment of relative importance of individual attribution elements.
There is also some evidence that individual differences in causal attributions may be limited to certain conditions. For example, Davis and Davis (1972) reported that the difference in causal attributions between individuals classified as Internals and Externals as measured by the I-E Scale occurred primarily in a failure condition. Unfortunately, the I-E Scale does not provide separate scores of internality under success and failure conditions.
Recent research on causal attribution has demonstrated various attribution biases or errors (Ross, 1977). For example, success-failure biases take the form of stronger internal attributions following success than following failure, and self-other biases typically refer to stronger dispositional attributions for others but a stronger situational attribution for self. These biases have been demonstrated mainly in between-subjects studies. In no study, however, have all the biases within the same subject been shown. It remains an interesting question whether individuals who differ in attribution schema also differ in attribution biases.
In view of the previously described developments in research on causal attributions, it seems advantageous to develop a questionnaire to measure individual differences in attribution schema based on Weiner’s model. The questionnaire should be constructed in such a way that it would provide a profile of attribution schema in different conditions (self-success, other-success, self-failure, and other-failure); that the attribution can be partitioned into the locus of control and stability dimensions; and that attribution biases can be derived. Thus the purpose of this investigation w a s to provide information regarding the validity and reliability of selected dimensions of a newly devised measure entitled Trent Attribution Profile (TAP).
Method
Test Development
The following criteria were used to generate questionnaire items: (1) both success and failure outcomes should be related to common life situations; (2) these situations should be achievement-related but not limited to academic situations; (3) other-orientation should be presented in general terms, e.g., “others,” “a person,” or an “individual.”
On the basis of these criteria, seven judges (including two psychology professors and five students in a third-year social psychology course) chose three common life situations: academic, social, and financial. In each situation, the two different outcomes (success and failure) that were presented in two different orientations (self and others) yielded a total of 12 different conditions. The Trent Attribution Profile (TAP) consists of 12 questionnaire items representing these 12 conditions. Each item is followed by four possible explanations based on four attribution elements. For example, the item on academic failure for others is presented this way: “When people fail school, it is because of (a) lack of academic skills, (b) bad breaks, (c) lack of effort; and (d) harsh judgements by the teachers.” In the case of academic success for self, the item is phrased this way: “My good marks in school were due to (a) easy marking by the teacher, (b) hard work on my part, (c) good luck, (d) my academic skills.”
Respondents were asked to rate the importance of each of the four explanations for each item o n a 5-point scale, with 1 meaning not at all important, 3 undecided, and 5 very important. In scoring the TAP, ratings in the three different life situations are summed to reflect generalized beliefs regarding causal attributions. The TAP thus provides a profile of attribution schema in four different conditions: (a) self-success, (b) other-success, (c) self-failure, and (d) other-failure. Discrepancies between different conditions indicate the direction and magnitude of attribution biases. For example, success- failure bias may be indicated by higher internal attributions but lower external attributions in success conditions as compared to failure conditions.
Subjects
In Study 1, the subjects consisted of 30 males and 30 females, with a mean age of 25.2. In each sex, half of the subjects were Trent University students, and the other half primarily consisted of public school teachers and office workers. In Study 2, the subjects were 21 male and 15 female Trent University students, with a mean age of 22.1.
Procedure
In Study 1, the subjects were approached individually and given the I-E Scale and TAP to complete. In Study 2, the subjects were given the TAP twice, with an average inter-test interval of four weeks.
Results
Validity Data
In Study 1, the total Internality rating of TAP (combining ability and effort ratings) was correlated significantly with the Internality score of the I-E Scale (Pearson’s r = .51, p < .001). The I-E Scale was also correlated significantly with ability and effort ratings (rs = .37and .49, ps < .01 and < .001, respectively). The attribution differences between internals and externals as defined by a median split in the I-E Scale are shown in Table 1. Consistent with the literature (Davis & Davis, 1972), internals and externals differed primarily in the failure condition. It is also informative to note that effort and task difficulty attributions are most sensitive in differentiating between internals and externals. (More detailed profiles of internals and externals involving further differentiation into self-success, other-success, self-failure, and other-failure are not presented in this paper, because they do not yield additional information in this particular sample.)
Differences in attribution biases between internals and externals were also calculated on the basis of the discrepancy scores. Results showed that externals did have a greater success-failure bias than did internals in task difficulty attribution (t = 2.32, p < .05). In other words, the fact that externals did exhibit a stronger task difficulty attribution than did internals in failure resulted in a larger success- failure discrepancy score. One can also detect this difference by inspecting Table 1.
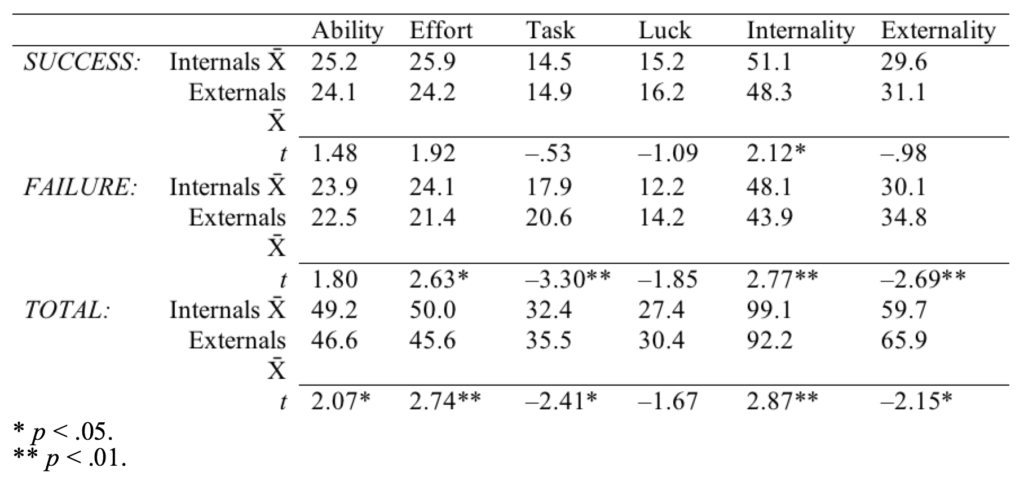
Table 1. Differences in Attributions between Internals and Externals as Defined by Rotter’s I-E Scale.
Evidence for the construct validity of the TAP was further enhanced by the findings of traditional attribution biases within the same sub- jects. When dependent t-tests were computed on the differences in attribution ratings by the same subjects, it was found that success did produce higher internal ratings than did failure, that higher dis- positional ratings (i.e., ability) were given to others than to self, but that higher situational attributions (i.e., task) were given to self than to others. These biases were obtained in the first study as well as in both the test and retest of the Study 2 (p < .01 in all cases).
Reliability
The test-retest reliability coefficients are presented in Table 2. In all four attribution elements, the reliability coefficients of total rating scores in the TAP were of the same magnitude as those associated with the I-E Scale (i.e., Rotter, 1966). Dependent t-tests failed to reveal any significant difference between test and retest in all attribution ratings in the TAP.
Discussion
The significant correlations between the I-E Scale and the internal attribution elements in the TAP furnish promising evidence for the validity of the TAP as an instrument to measure locus of control. There are several advantages of using the TAP: (1) it provides separate measures of internality (ability and effort), externality (task difficulty and luck), stability (ability and task difficulty), and unstability (effort and luck); (2) it yields a profile of attribution ratings under four different conditions (self-success, other-success, self-failure, other-failure); and (3) it allows a determination of attribution biases.
Given that the I-E Scale has been shown to be related to a number of personality and performance variables (Lefcourt, 1976), it is now possible to determine which attribution elements under which conditions in the TAP really account for the variances. Since all three common life situations simulated in the TAP are achievement-oriented, the TAP may be more predictive of achievement behavior than the I-E Scale which actually contains subscales related to just world belief and political unresponsiveness. (See Lefcourt, 1976).
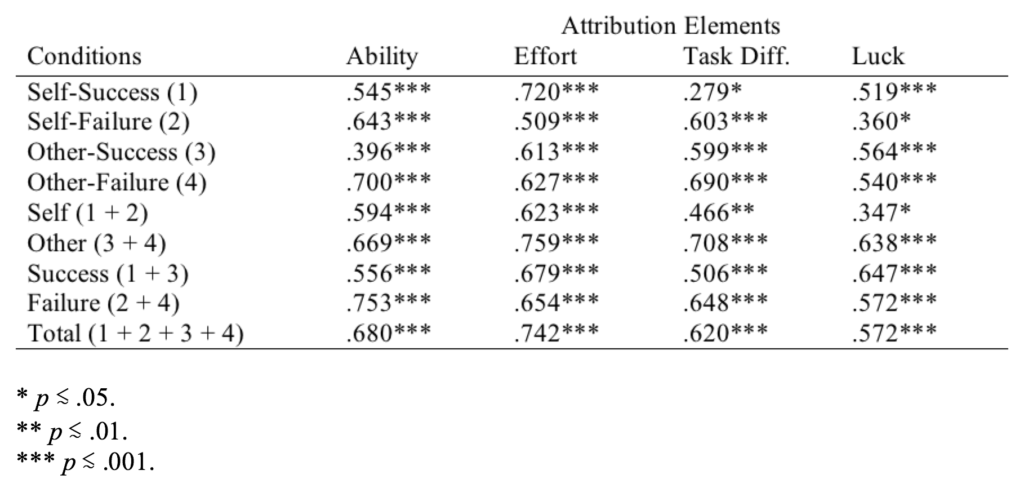
Table 2. Test-Retest Reliability Coefficients (Pearson rs)
1 Attribution schema, in the present paper, refer to generalized beliefs regarding causal attributions about common life events as different from specific causal attributions about performance in a specific, concrete situation.
References
- Davis, W. L., & Davis, D. E. (1972). Internal-external control and attribution of responsibility for success and failure. Journal of Personality, 40, 123-136.
- Frieze, I. (1973). Studies of information processing and the attributional process. Unpublished doctoral dissertation, University of California, Los Angeles.
- Lefcourt, H. M. (1976). Locus of control: Current trends in theory and research. Hillsdale, NJ: Erlbaum.
- Ross, L. (1977). The intuitive psychologist and his shortcomings: Distortions in the attribution process. In L. Berkowitz (Ed.), Advances in experimental social psychology (Vol. 10; pp. 174-220). New York, NY: Academic Press.
- Rotter, J. B. (1966). Generalized expectancies for internal versus external control of reinforcement. Psychological Monographs, 80(1).
- Weiner, B., Frieze, I., Kukla, A., Reed, L., Rest, S., & Rosenbaum, R. M. (1971). Perceiving the causes of success and failure. In E. E. Jones, D. E. Kanouse, H. H. Kelley, R. E. Nisbett, S. Valins, & B. Weiner (Eds.), Attribution: Perceiving the causes of behavior. Morristown, NJ: General Learning Press.
Cite
Wong, P. T. P., Watters, D. A., & Sproule, C. F. (1978). Initial validity and reliability of the Trent Attribution Profile (TAP) as a measure of attribution schema and locus of control. Educational and Psychological Measurement, 38, 1129-1134.
To find out more about the Trent Attribution Profile, please read Wong, P. T. P., & Sproule, C. F. (1984). Attributional analysis of locus of control and the Trent Attribution Profile (TAP). In H. M. Lefcourt (Ed.), Research with the locus of control construct, Vol. 3: Limitations and extensions (pp. 309-360). New York, NY: Academic Press.
